


※ Documentation
Frequently Asked Questions:
1. Q: How to use GPS-MSP 1.0 software?
A: You can find the latest version of GPS-MSP 1.0 at http://msp.biocuckoo.org/download.php. Then download and install the GPS 3.0 software to your computer.Currently, GPS-MSP 1.0 is implemented in JAVA and could be installed on a computer with Windows/Linux/Unix/Mac OS . And we also wrote a manual for users which included in the installation package.
2. Q: What's the difference between simple prediction and comprehensive prediction?
A: The only difference between simple prediction and comprehensive prediction is that the simple prediction didn't provide annoations of surface accessbility and secondary structure. The annoations of surface accessbility and secondary structure were provided by NetSurfP ver. 1.1 (PMID: 19646261), which needs long-time computation. So, in the simple prediction, the surface accessbility and secondary structure are not visulized.
3. Q: How to read the GPS-MSP 1.0 results?
A: Here we use the human p53 protein as the example. After clicking "Submit", the prediction results will be shown as follows:
<1>. The table of the GPS-MSP 1.0 results (Page 1)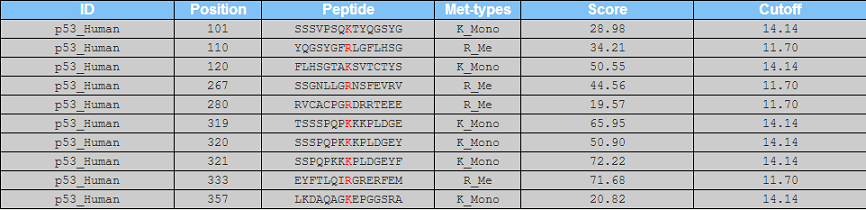
ID: The name/id of the protein sequence that you input to predict.
Position: The position of the site which is predicted to be methylated.
Peptide: The predicted methylated peptide with 7 amino acids upstream and 7 amino acids downstream around the modified residue.
Met-type: The methylation type which is predicted to methylate the site.
Score: The value calculated by GPS algorithm to evaluate the potential of methylation. The higher the value, the more potential the residue is methylated.
Cutoff: The cutoff value under the threshold. Different threshold means different precision, sensitivity and specificity.
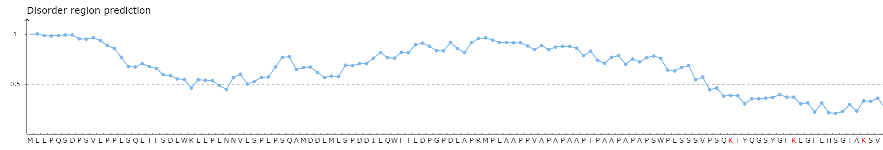
<2>. The visualization of simple prediction
Part 1: The visualization for protein disordered region predicted by IUPred [PMID: 15955779]. Cutoff = 50%, if score of prediction > cutoff, the residue is considered in disordered region.
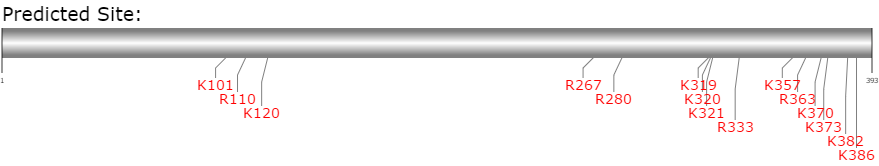
Part 2: The visualization of the positions of the predicted methylation sites in the protein sequence.
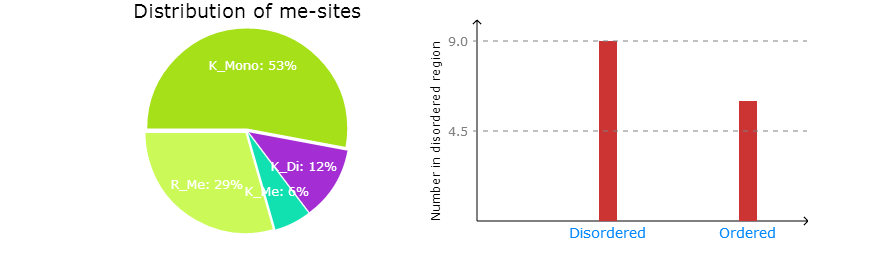
Part 3:
Left: The distribution of predicted methylation sites for methylation types.
Right: The distribution of predicted methylation sites in disordered region.
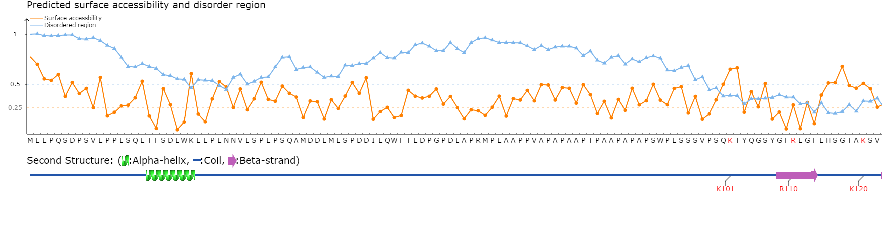
<3>. The visualization of comprehensive prediction
Part1:
Top: The surface accessbility of amino acids and the protein disordered region were predicted by NetSurfP ver. 1.1 (PMID: 19646261) and IUPred (PMID: 15955779), respectively. The cutoff of disordered region prediction = 50%, if score of prediction > cutoff, the residue is considered in disordered region. The cutoff of surface accessbility prediction = 25%, if score of prediction > cutoff, the residue is considered as surface exposed residue.
Bottom: The positions of the predicted acetylation sites were visualized in the protein sequence together with the secondary structure predicted by NetSurfP ver. 1.1 (PMID: 19646261).
Part 2 :
Left: The distribution of predicted methylation sites for methylation types.
Middle: The distribution of predicted methylation types sites among secondary structures.
Right: The distribution of predicted methylation typesn sites in disorder region.

4. Q: Is GPS-MSP 1.0 accurate?
A: Yes, but not all. Prediction of type-specific methylation sites is a greatly difficult problem. If the training data is enough, the prediction is satisfying and accurate. But the training data set are very limited, to make the performance lower. For type-specific prediction, no algorithm or approach could reach the best performances for all of the methylation types. However, by comparison, the prediction performances of GPS-MSP are better or at least comparable with previous tools. And also, we will updated the GPS-MSP routinely to make it more accurate and powerful.
5. Q: How to choose the cut-off values and the thresholds?
A: Firstly, we calculated the similarity scores for each methylation type cluster. The three thresholds of GPS-MSP 1.0 were decided based on calculated Specificity. For all methylated types, the high, medium and low thresholds were established with specificity of 99%, 95% and 90%. The high threshold was designed for ocassions with strict requirement for false positive ratio(AKA, ratio of negtive sites which predicted as positive). And the medium threshold relaxed the stringency to be useful in small-scale experiments. Also, the low threshold reduced the Sp to improve Sn considerably to be useful in exhaustively experimental identifying all potential methylated sites.
6. Q: What's the meaning of Specificity (Sp)? How do you calculate cutoff based on Sp?
A: Specificity (sometimes called the true negative rate) measures the proportion of negatives which are correctly identified as such (e.g., the percentage of healthy people who are correctly identified as not having the condition). If we got 1000 negtive sites and 1000 positive sites and we want cutoff score while sp=0.9, we calculate the cutoff following these principles:
- (1) Calculated similarity scores for all positive and negative sites.
- (2) Sort all scores, increase cutoff from 0, until similarity scores of 90% of negative sites are below cutoff.
- (3) We got the cutoff we want.
7. Q: I have 20,000 proteins for prediction, what should I do?
A: For a large-scale prediction, we recommend two approaches for you. You can input the sequences for 20 times, with 1,000 proteins per time. Also, please download a stand-alone software of GPS-MSP 1.0 linked as below. In the stand-alone versions, the limitation of sequences number is removed. You can use "Batch Predictor" in the local software for a large-scale prediction.
8. Q: What does these metylation type mean?
A: Methylation ocurred on lysine and arginine mostly, for lysine, metylation can be catalyzed into three form, mono-methylation, di-methylation and tri-methylation, according to numbers of methyl-group transfered to lysine residue. Also, arginine methylation can be catalyzed into three forms, mono-methylation, symmetry di-methylation, asymmetry di-methylation, according to numbers and positions the substitution reaction happened. Methylation types show in form are listed below:
- K-Mono: mono methylation of lysine
- K-Di: di-methylation of lysine
- K-Tri: trimethylation of lysine
- K-Me: methylation of lysine, if this type was chosen, the predictor will not give out the methylation type of predicted sites.
- R-Mono: mono-methylation of arginine
- R-S.di: symmetry di-methylation of arginie
- R-A.di: asymmetry di-methylation of arginine
- R-Me: methylation of arginine, if this type was chosen, the predictor will not give out the methylation type of predicted sites.
- R-Di: di-methylation of arginine, if this type was chosen, the predictor will not give out wehther this dimethylation site is symmetry or asymmetry.
9. Q: I want to know wether the performance of GPS-MSP 1.0 is tested and the result, where can I find it?
A: All predictors are validated using Leave-one-out method and N-fold cross validation, all information can be find in our paper and supplementary information. Here we list part of the validation results.
| Type | High | Medium | Low | ||||||
| Pr(%) | Sn(%) | Sp(%) | Pr(%) | Sn(%) | Sp(%) | Pr(%) | Sn(%) | Sp(%) | |
| K-Me | 41.78 | 23.58 | 99.01 | 19.94 | 41.05 | 95.04 | 11.92 | 44.51 | 90.10 |
| K-mono | 53.43 | 27.21 | 99.02 | 28.99 | 48.71 | 95.07 | 18.57 | 51.65 | 90.65 |
| K-di | 55.32 | 25.91 | 99.01 | 34.32 | 53.82 | 95.11 | 21.09 | 55.48 | 90.15 |
| K-tri | 72.14 | 39.61 | 99.07 | 48.21 | 74.12 | 95.15 | 33.51 | 75.29 | 90.90 |
| R-Me | 45.28 | 18.91 | 99.01 | 28.85 | 46.53 | 95.01 | 21.46 | 62.80 | 90.01 |
| R-mono | 43.18 | 19.88 | 99.00 | 25.82 | 45.50 | 95.01 | 19.33 | 62.73 | 90.01 |
| R-s-di | 73.53 | 39.06 | 99.13 | 49.49 | 76.56 | 95.16 | 24.63 | 78.13 | 85.20 |
| R-a-di | 31.55 | 10.54 | 99.02 | 21.54 | 31.46 | 95.07 | 13.23 | 35.03 | 90.11 |
| R-di | 41.30 | 16.06 | 99.00 | 27.47 | 43.06 | 95.03 | 20.56 | 59.18 | 90.01 |
10. Q: I have a few questions which are not listed above, how can I contact the authors of GPS-MSP 1.0?
A: Please contact the three major authors: Wankun Deng, Yongbo Wang, and Dr. Yu Xue for details.